
What to Do with Consolidation Patterns in Penny Stocks
Consolidation is about the turnover of penny stock shareholders, first and foremost. When the investors who bought more recently replace those who want to sell (and by implication have high expectations for the shares to go higher from current levels), downward pressure on the stock is replaced by demand.
This technical analysis (TA) pattern predicts a sudden and sharp price increase, and when formed properly is one of the more reliable indicators. While not always present in most stocks, when you’re certain that a consolidation pattern has formed, it can represent an opportunity to take significant profits.
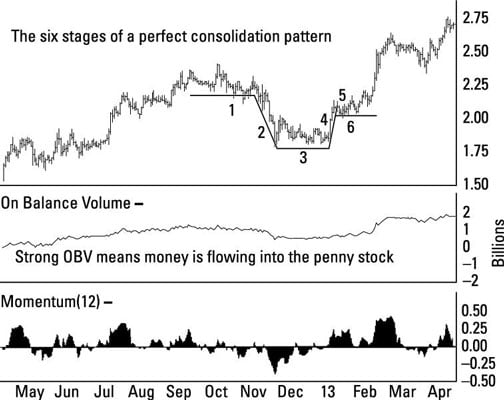
On the trading chart, the share price will look like it’s forming a cup and handle. The indicator is generated in the following phases, and in this exact order:
- Before the cup forms.Shares first approach what will eventually become the cup pattern. This approach is flat and sideways trading, in a very tight price range.
- Shares fall steeply, forming the left side of the cup.Shares fall relatively steeply and quickly in price as some investors grow tired of the lack of volatility in the stock. This drop usually occurs in a matter of days and forms what will eventually look like the left edge of the cup and handle pattern.
- Sideways trading after the drop forms the bottom of the cup.Shares eventually stop falling and enter a tight sideways range for several weeks. During this time, many sellers stop selling because they’re unwilling to unload their shares at these prices. At the same time, buyers see value, thus creating a price floor that limits any further downside. Shares neither spike higher or lower as the bottom of the cup forms.
- Share price rises, forming the right side of the cup.For almost the exact amount of the fall (which formed the left side of the cup), and just as quickly, shares will jump higher. The trading chart will now show price activity that looks as if a cup pattern has formed. Sudden demand overpowers the last of the sellers who would take the lower price, and after they are gone, the shares respond to even minimal buying by moving higher.
- Reactionary fall.After the sudden price spike, some shareholders who had been on the sidelines move back in to take advantage of the price jump. Even the buyers get spooked by the speed of the move and aren’t interested in paying these “expensive” prices. Shares fall back lower, although only partially. They settle slightly lower than the high in the latest price spike, yet well above the bottom of the cup pattern.
- The handle forms.After the spike and the reactionary sell off, shares enter a narrow sideways trading range, forming the handle of the cup pattern. During this time, old shareholders turn over in favor of new ones, so that an increasing percentage of investors in this company expect good things from the share price going forward and aren’t likely to sell.
Think of the handle of the consolidation pattern like a spring that is slowly coiling. The greater percent of shareholder turnover during this time period, the more pronounced the subsequent upward move will be and the more reliable the indicator.
Check the daily trading volume as the handle forms. If 100 million shares are out and 1-million shares trade in a single day, that’s a trading volume of 1 percent. If approximately the same number trade each day for the next three weeks, that’s a trading volume of 15 percent.
For shares to trade, there must be both a buyer and a seller. Of course, a seller one moment can be a buyer the next. While this fact makes it impossible to accurately gauge shareholder turnover, for the purposes of TA it is sufficient to count a share traded as a share turned over to a new owner.